
A healthcare client operates a two-way marketplace app for staffing. They asked me to provide a list of zip codes in which their Facebook ads would have the highest impact.
"How do we get the most out of our social media marketing spend?"
I decided to leverage the marketplace data and give them a tool they could use to identify which markets had the highest demand relative to supply. By pinpointing geographies in which healthcare facilities had the highest number of unfulfilled shifts relative to active practitioners, I ranked and quantified the total need for new nurses for each market.
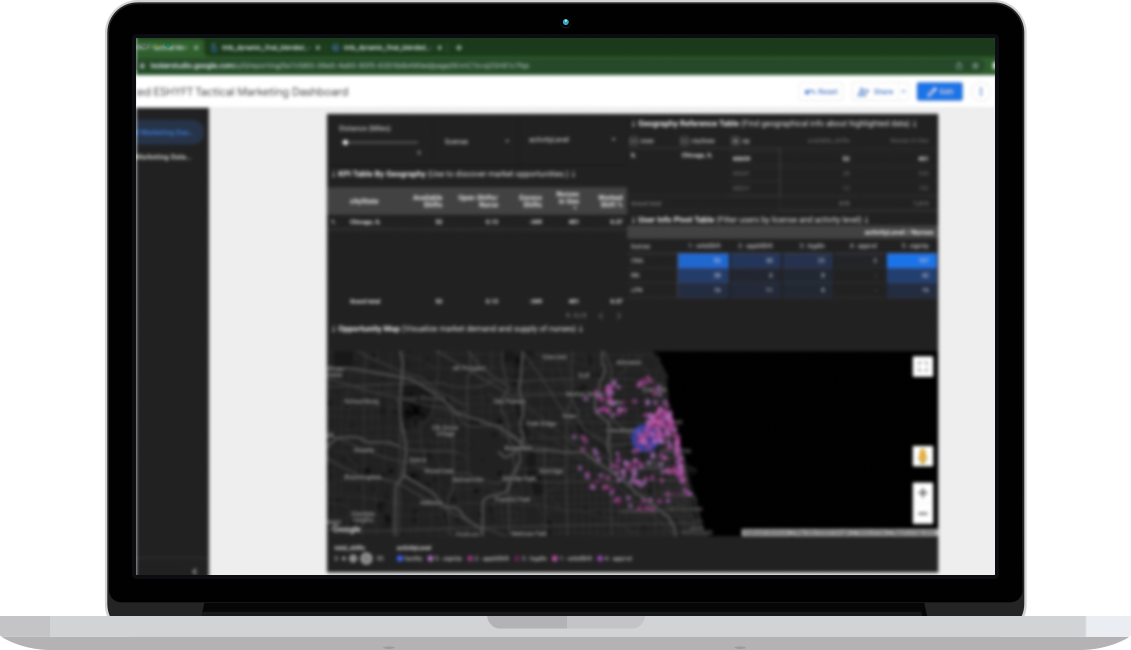
Tactical Marketing Dashboard
The Dashboard was created in Looker Studio, and has 2 tabs:
Outbound Marketing Dashboard
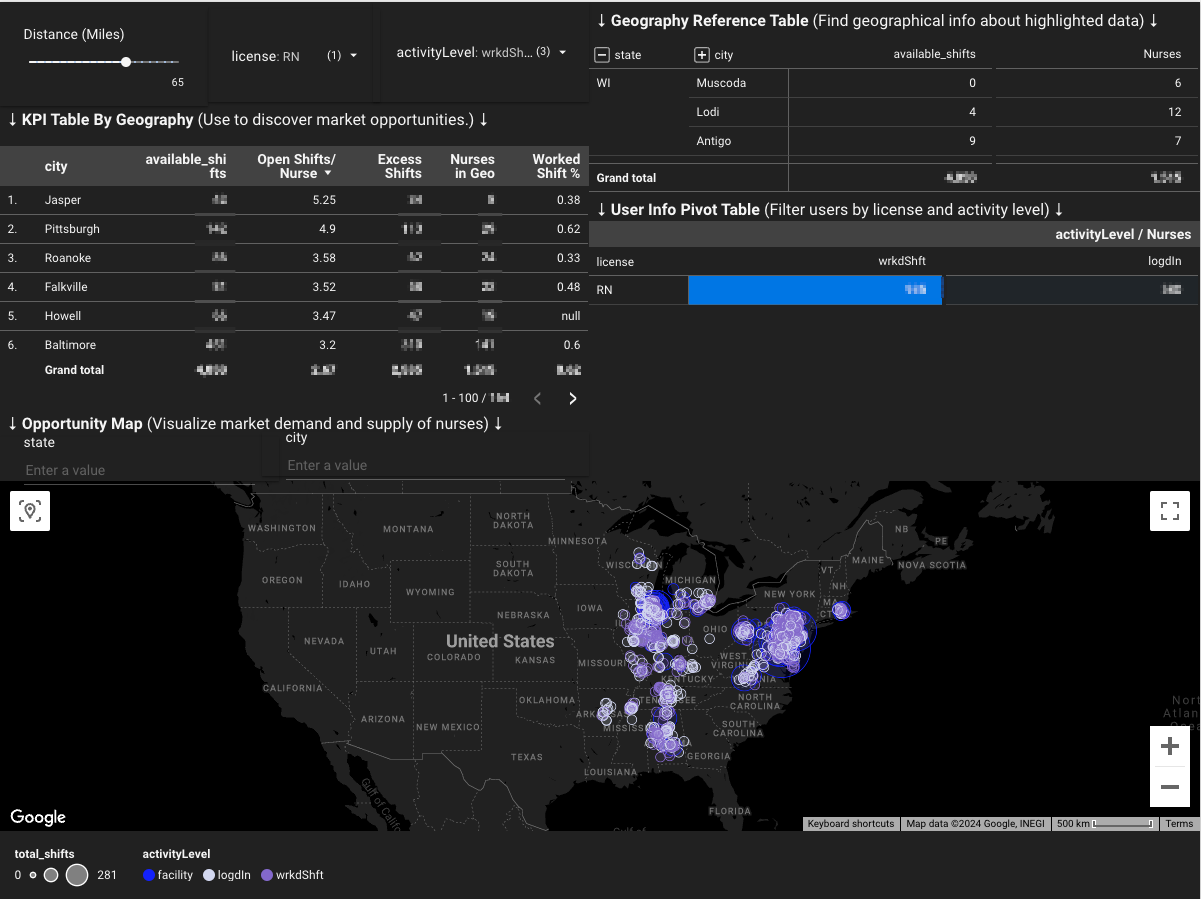
An interactive map that shows number of practitioners in each geography by discipline and activity level, and combines it with unfulfilled shifts posted by facilities. A slider at the top allows the users to adjust the radius around each facility to calculate which nurses are eligible for those shifts. It ranks the cities and zipcodes by this "excess demand" and allows an easy print out to google sheets or csv.
Inbound Marketing Dataset
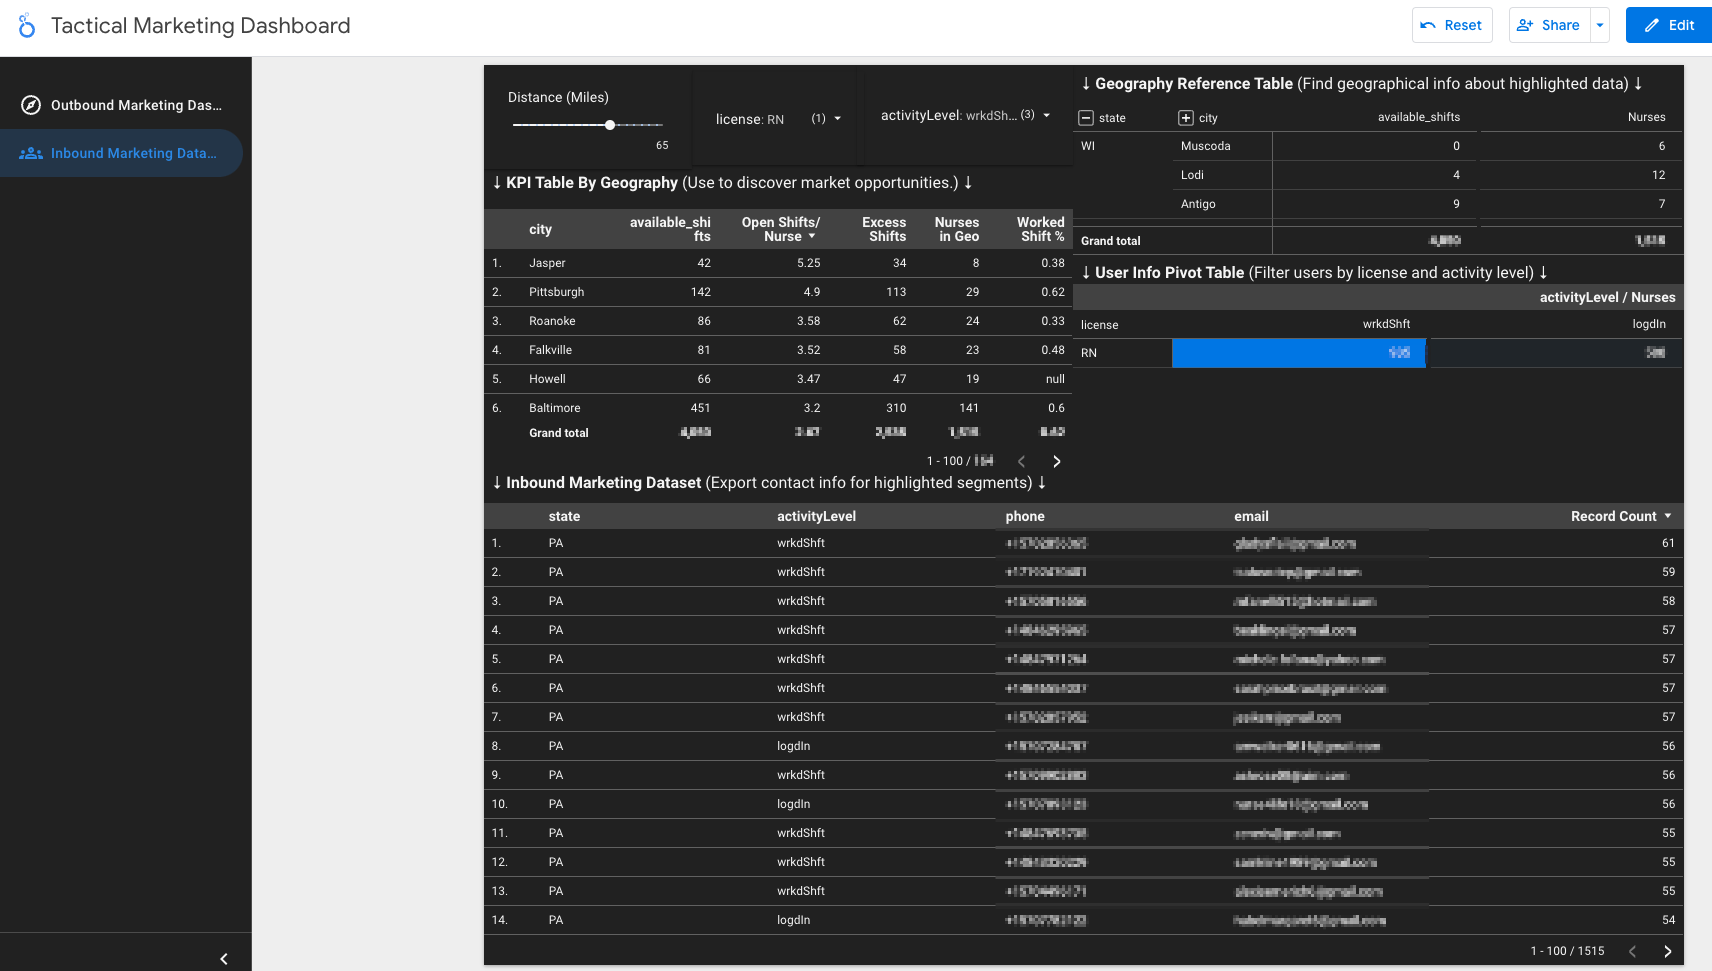
An in-depth rolodex of all of the users that fit the defined filters from the Outbound Marketing Dashboard. For example, if I identify that the top 10 markets in terms of "excess demand" based on a specific discipline of practitioners within 15 miles of each facility, the "Inbound Marketing Dataset" tab will show me a full list of their contact info that can be easily exported to an email list, sms blast, or ads audience.
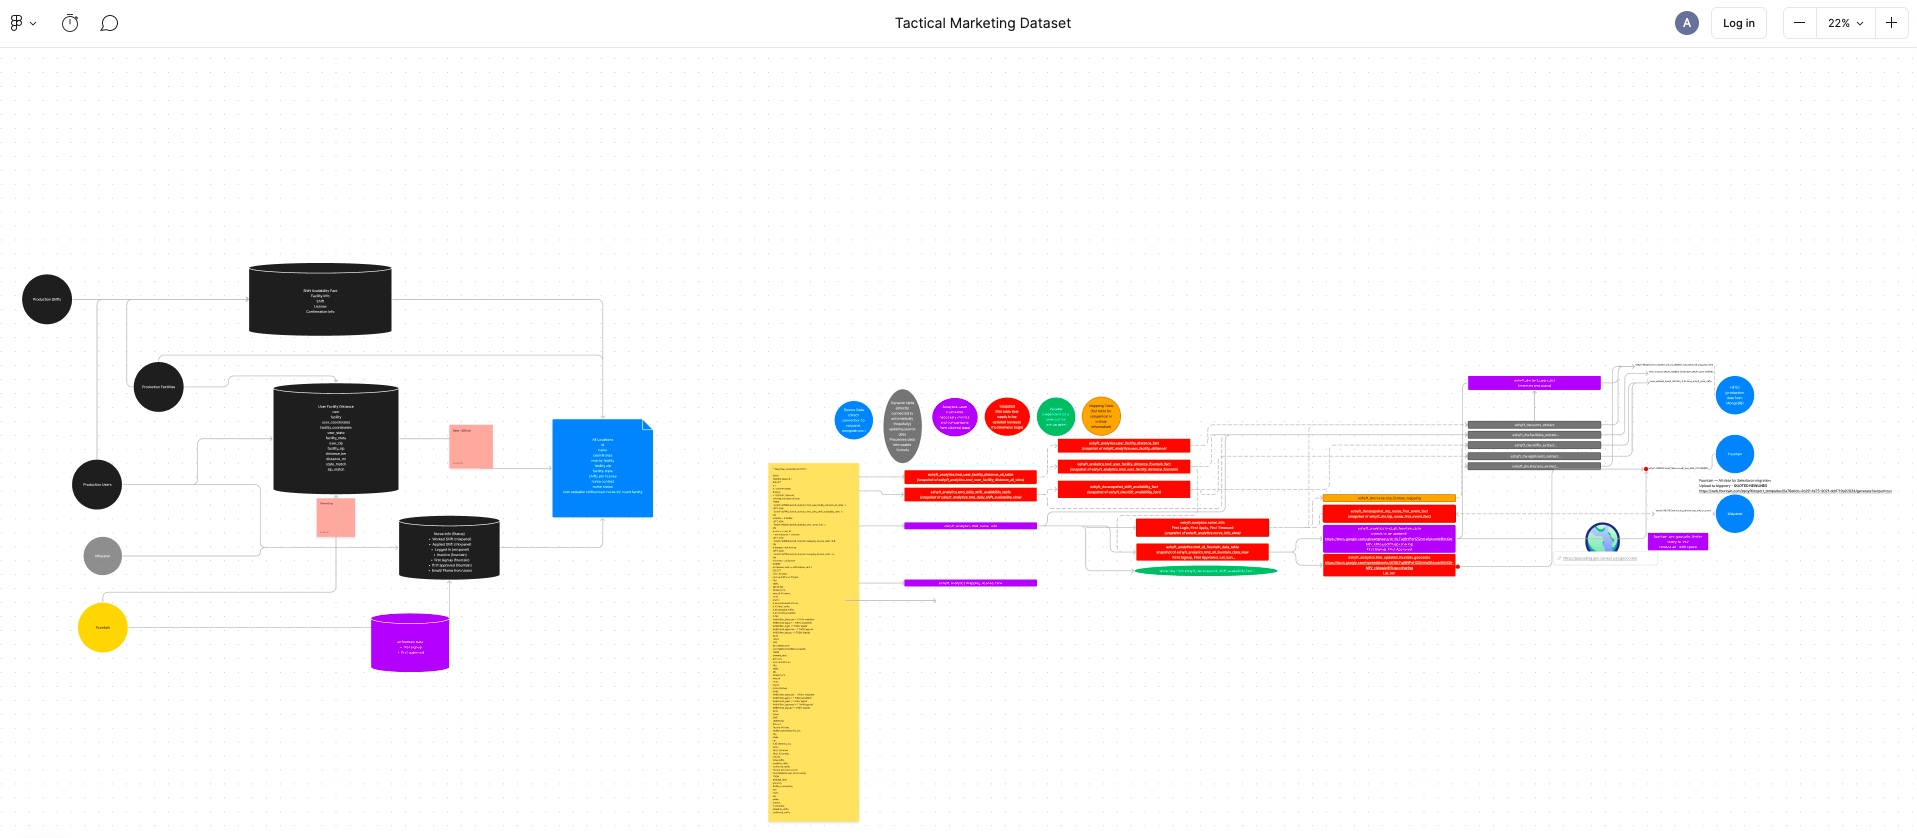
n.The dataset is built from managed pipelines from MongoDB, Fountain ATS, and Mixpanel data. It is powered by transformation queries in BigQuery and an automated geocoding function.
.png)

.webp)